Home » Posts tagged 'X-Ray Tomography'
Tag Archives: X-Ray Tomography
X-Ray Computerized Tomography Test of a Fractured Specimen
I. X-ray Computerized Tomography (CT)
X-ray CT is a three dimensional (3D) radiographic imaging technique. Unlike the conventional X-ray CT systems used in medical and industrial applications, which have a maximum spatial resolution of about 1 mm, X-ray computerized tomography is capable of achieving a spatial resolution close to 0.001mm. X-ray CT also provides non-destructive three-dimensional images of the interior of objects by mapping the X-ray absorption through the specimen.
Earlier CT scanners used a linear array of photo-detectors, a fan beam, meant tomographic slice images had to be acquired and reconstructed one plane at a time (Fig. 1.1a). Subsequent application of 2D detectors allowed the acquisition of 2D projection images using a cone beam, (Fig. 1.1b and 1.1c) leading to faster scan times. Synchrotron radiation as an X-ray source has improved the imaging. This can be done because of the many orders of magnitude of emitted light and also X-ray beam collimation (the parallel beam shown in Fig. 1.1d).
(a) illustrates a fan beam, in which projection data must be acquired slice by slice. (b) and (c) illustrate cone beam and parallel beam configurations, respectively. In these configurations, complete 2D projections can be acquired in a single step. (d) Illustrates the error associated with a non-point X-ray source. The intensity acquired at a particular point on the detector is made up of rays from different parts of the source that passed through different parts of the specimen, confounding the line-integral representation of the acquired intensity at the point (Landis et al., 2010).When a material is exposed to a beam of X-rays, the incoming radiation is either reflected and scattered, absorbed and re-emitted as lower energy electromagnetic radiation (Photoelectric effect) or transmitted through the material. The percentage of incoming radiation transmitted is a function of material thickness, density and chemical composition. Beers’ law is used to relate the intensity of the transmitted radiation, I, to the material properties lumped in the attenuation coefficient, μ, and the distance traveled through the material, x:
I = Ioe−μx
This empirical relation is valid for a single wavelength, i.e. a “monochromatic” or mono-energetic beam. The attenuation coefficient is also a function of the wavelength of the incoming radiation, with the lower energy photons absorbed more easily. This is of consequence, since most X-ray sources generate a poly-energetic beam, and as the beam penetrates the material, the attenuation coefficient varies. This effect is called beam hardening (since the higher energies are transmitted farther into the specimen) and generates a noticeable pattern in the scanned image, if the material is not uniform in thickness, that must be corrected via post-scan processing.
The specimen, placed on the turntable, is subjected to a cone-beam type X-ray for about 3 minutes and the detector receives the X-ray through the specimen. A computer records information for each degree of rotation of the X-ray collected by the detector. The information from the detectors is processed by the CAT-scanner’s computer to generate the image using the signal from several detectors to generate a two-dimensional image of the cross-section. The resulting image in the scanner is a 512 x 512 matrix or 1024 x 1024. Typically, the signal in each pixel is expressed in CT units:
where μw is the attenuation of pure water. The scanner is usually calibrated to result in a CTwater = 0 and CTair = -1000.
I.1 Networks extraction
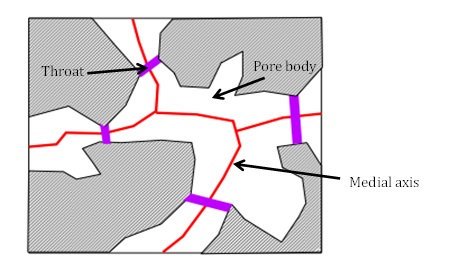
Pore networks extracted from the pore space images are required to observe the connectivity of space of fractures in material. Medial axis based algorithm, maximal ball algorithm and Voronoi diagram based algorithm are some of the commonly used methods to extract networks from images. Lindquist et al., (1996) used the medial axis transform, based on a thinning algorithm, to reduce the pore space to its one-dimensional line skeleton with the junction in the skeleton forming the pore bodies while the chains of voxels connecting them were taken as the pore throats.
I.2 Pore geometry
Real pores and throats have highly irregular and complex geometry that allow two or three phases to be simultaneously present in a single pore or throat. Most early work in pore scale modeling assumed that the throats were cylinders with circular cross-sections while pores were spherical or cylindrical in shapes. Pore is defined as circle within the maximum void space while throat is the locally minimum of the cross-sectional area in each “channel”. Medial axis for pore is shown by straight line passing through the center point and axis of rotational symmetry for throat medial axis (see Figure 1.2).
II. X-ray CT of a fractured specimen
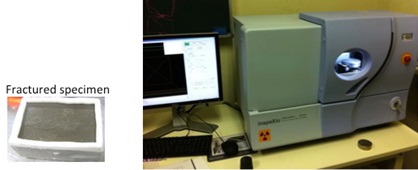
A fractured specimen, generated in shear-flow coupling test applying 0.085 MPa of initial normal stress (with Constant Normal Load type), was examined (see Figure 2.1 bellow). The fractured specimen was in unsaturated condition during X-ray CT test.
II.1 CT-Scanning
CT scanning is carried out as follows. The specimen, placed on the turntable, is subjected to a cone-beam type X-ray for about 3 minutes and the detector receives the X-ray through the sample. A computer records information for each degree of rotation of the X-ray collected by the detector. This information is data for the X, Y, and Z directions for the whole of volume divided into 10243 voxel images. Finally the data is reconfigured and a 3D shape is rearranged. Specifications of this CT Scanner (VGStudio MAX 2.1) are below: the spatial resolution is 0.01mm, the voltage is 90 kV, the current is 110 μA, and the pixel resolution is 0.01 mm.
After CT-scanning, an X-ray CT image is a regular array of X-ray attenuation coefficient values. Each value is interpreted as representing the average X-ray attenuation from a volume element (voxel) in the imaged region of the specimen. The specimen being imaged is assumed that it consists of two phases; they are a grain (a single material type) and void phase.
II.2 Segmentation
Segmentation is the process of converting a gray-scale or colored image to a binary image by identifying two populations in the image based on their intensity values. The simplest approach, based upon choice of single global threshold, was used for entire images of a specimen. This threshold value is chosen to enforce the agreement with a bulk measurement of the porosity (volume fraction of the void phase).
II.3 Pore-throat’s analysis
The procedure consists of two steps: the medial axis (pore network) construction and the throat extraction. The medial axis of a specimen is the skeleton of the void space of an image and it runs along the voids geometrical middle and it is determined by voxels where different solid-pore boundaries intersect. Pores are identified as the volumes around the voxels that have the local maximum distances from the surface, and similarly, the throats are defined by voxels that have the local minimum distances’ measurement (See Figure 2.2). Pore-throat’s analyses (effective pore and throat radii, pore and throat volume, and pore network images) are analyzed by the special 3D porous/particle analysis software (EXFACT image analysis software), once the images are segmented (see table 3.1).
III. X-ray CT result of a fractured specimen
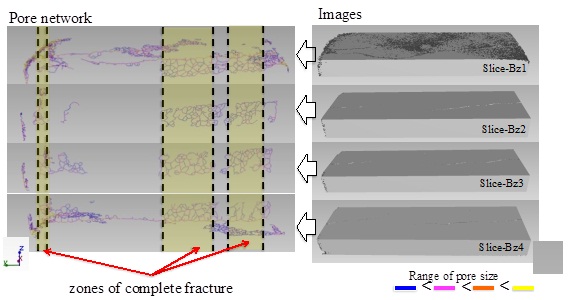
Fractured specimen was scanned and measured 47x30x19mm (originally size was 60x40x20mm). For analysis, 47x15x19mm was big enough to be representative (See Figure 3.1). For analysis of fractures, the specimen was segmented with 5 mm of slice thickness. Figure 3.2 shows the fractured specimen slices including the pore network analysis of specimen in Z-direction.
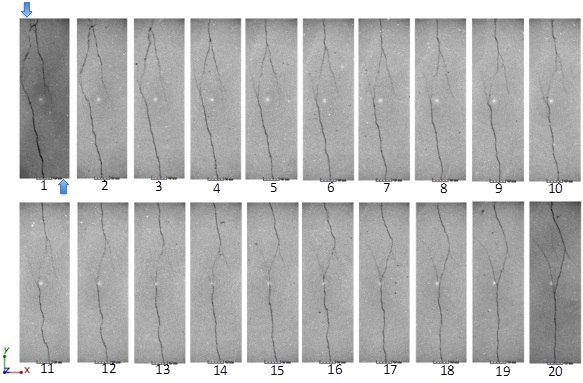
In XY plane dir. Slices result (see Figure 3.2), images and pore network combination had three zones of connected pore network. It means that fractures in these zones were connected from top to bottom while other areas had pore network disconnected from top to bottom meaning that they had disconnected fractures. X-ray CT scans (Figure 3.3) of fractured specimen reveals the fracture patterns from top to bottom.
IV. Conclusion
X-ray CT can provide a reliability analysis of a fractured specimen (not only for soil material or grains). From pore network connectivity analysis result, a fractured specimen can be distinguished in to connected and disconnected fractures. Fractures patterns can be observed from the X-ray CT scan result.
Reference
Landis, E. N. and Keane, D. T., 2010, “Tutorial review: X-ray microtomography”, Material Characterization, vol. 61, pp. 1305-1316. Lindquist, W. B., 2002, “Quantitative analysis of three dimensional X-ray tomographic images”, Proceedings of SPIE 4503, pp.103-115. Lindquist, W. B., Lee, S. M., Cooker, D. A., Jones, K. W., and Spanne, P., 1996, “ Medial axis of three dimensional topographic images of drill core samples’, J. Geophys. Res. 101, pp. 8297-8310.Author: FHP


